
USD/IDR Technical Analysis: 10-day EMA caps immediate upside, six-week low in focus
- USD/IDR carries the previous weakness below the 14,000 mark.
- November month lows hold the keys to July and September bottoms.
- Multiple troughs since mid-November offer additional resistance.
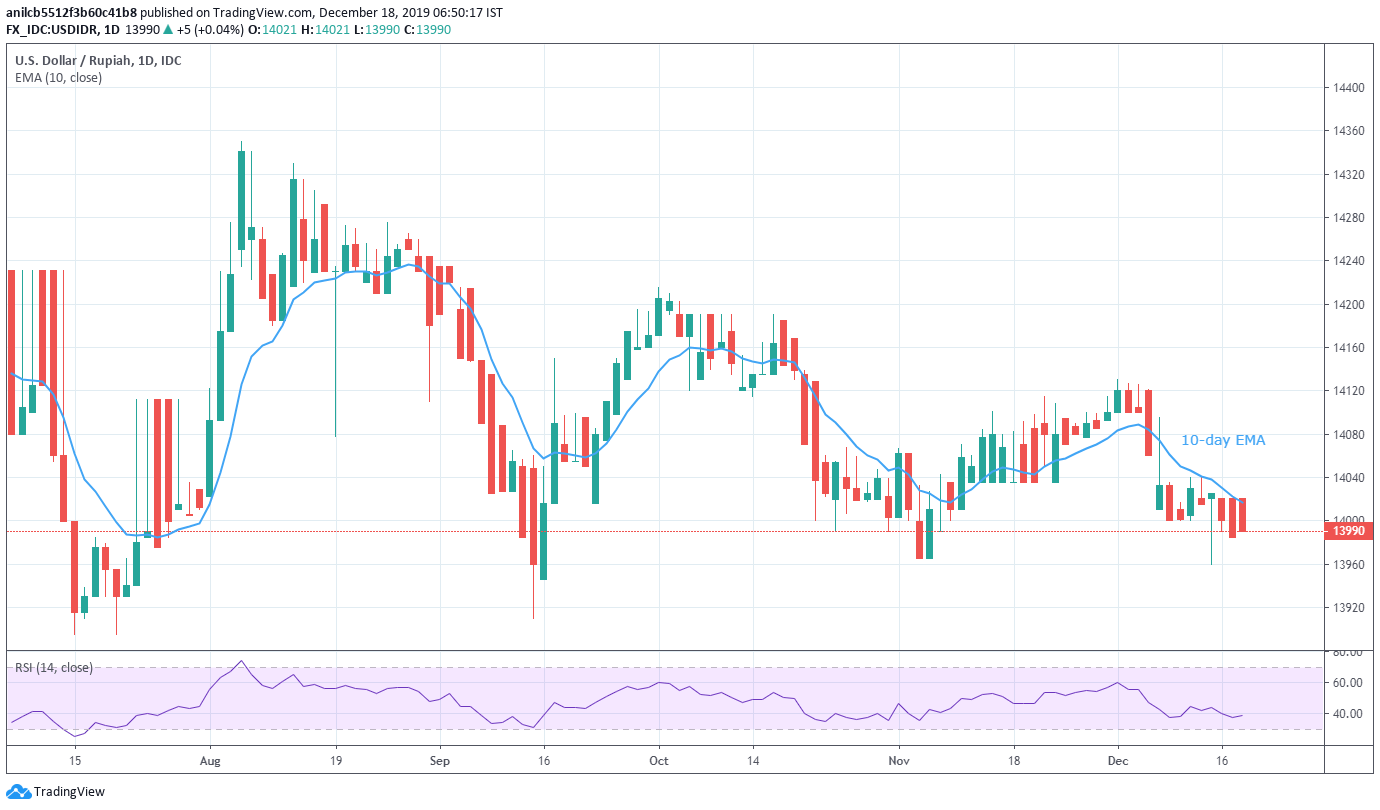
USD/IDR extends the two-day-old weakness to 13,990 amid Wednesday’s Asian session. The pair has been trading beneath 10-day Exponential Moving Average (EMA) since December 05.
With this, traders now take aim at November month lows near 13,965 during the further declines whereas 13,950 could become their follow-on target.
Though, pair’s further weakness below 13,950 could be tamed by lows marked in July and September months around 13,895 and 13,910.
Alternatively, a daily closing beyond a 10-day EMA level of 14,017 can trigger the pair’s recovery to multiple lows marked during November around 14,035/40.
If at all buyers manage to cross 14,040 on a daily closing basis, 14,100 and monthly top surrounding 14,130 will be on their radars.
USD/IDR daily chart
Trend: Bearish