
AUD/USD Price Forecast: Bulls challenge SMA cluster, eye 0.7100
- AUD/USD extends weekly gains, reclaiming 0.7000 and testing key resistance.
- Bulls challenge SMA confluence, with 0.7074 guarding further upside.
- Break above 0.7100 exposes 0.7150 and September high at 0.7237.
The Australian Dollar finished Friday’s session with gains of over 0.22% and the week up by more than 1.20%, with the pair reclaiming the 0.7000 figure and poised to test a confluence of key resistance levels within the 0.7000-0.7100 range. At the time of writing, the AUD/USD trades at 0.7035.
AUD/USD Price Forecast: Technical outlook
After climbing from around 0.6900 in mid-October to current exchange rates, the AUD/USD bias has turned bullish in the near term. Along with a constructive technical picture, expectations that the Reserve Bank of Australia (RBA) will increase rates again before next year, underpinned the Aussie.
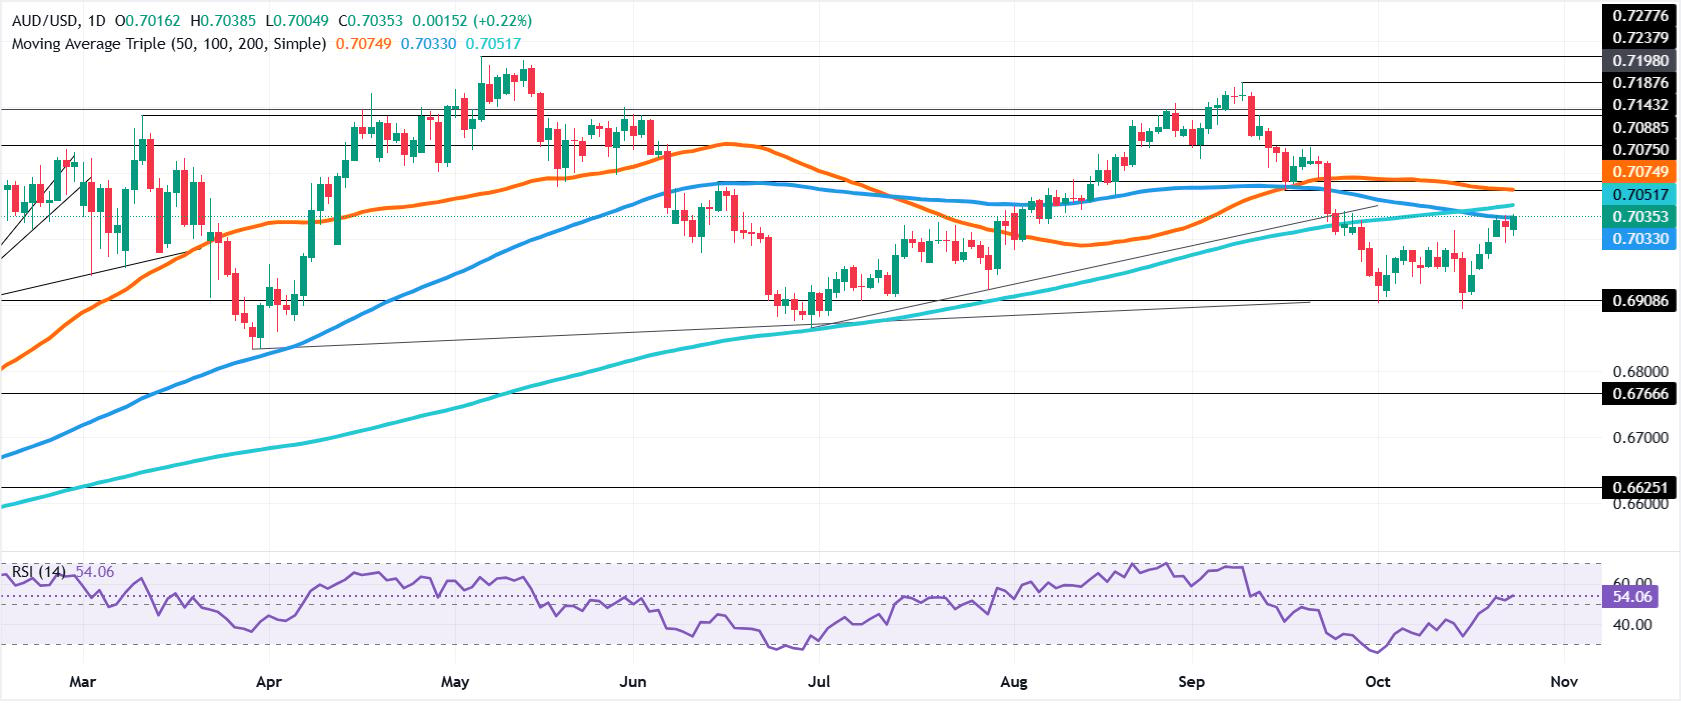
From a technical perspective, buyers face key resistance at the 100-, 50- and 200-day Simple Moving Averages (SMAs), each at 0.7033, 0.751 and 0.7074, respectively. Once that area is cleared, a potential move towards 0.7100 is on the cards.
Above the next stop is the 0.7150 psychological level, followed by the September 9 daily high of 0.7237. A move beyond that level will expose the year-to-date (YTD) high of 0.7277.
On the flip side, the first support for AUD/USD is the 0.7000 level. Once hurdled, the next area of interest would become the October 15 cycle low of 0.6894.
AUD/USD Price Chart – Daily
Australian Dollar Price This week
The table below shows the percentage change of Australian Dollar (AUD) against listed major currencies this week. Australian Dollar was the strongest against the US Dollar.
| USD | EUR | GBP | JPY | CAD | AUD | NZD | CHF | |
|---|---|---|---|---|---|---|---|---|
| USD | -0.15% | -0.46% | -0.77% | -0.81% | -1.12% | -0.74% | -0.14% | |
| EUR | 0.15% | -0.31% | -0.56% | -0.61% | -0.88% | -0.58% | 0.03% | |
| GBP | 0.46% | 0.31% | -0.25% | -0.30% | -0.56% | -0.26% | 0.41% | |
| JPY | 0.77% | 0.56% | 0.25% | -0.05% | -0.35% | 0.02% | 0.75% | |
| CAD | 0.81% | 0.61% | 0.30% | 0.05% | -0.29% | 0.09% | 0.71% | |
| AUD | 1.12% | 0.88% | 0.56% | 0.35% | 0.29% | 0.30% | 0.94% | |
| NZD | 0.74% | 0.58% | 0.26% | -0.02% | -0.09% | -0.30% | 0.66% | |
| CHF | 0.14% | -0.03% | -0.41% | -0.75% | -0.71% | -0.94% | -0.66% |
The heat map shows percentage changes of major currencies against each other. The base currency is picked from the left column, while the quote currency is picked from the top row. For example, if you pick the Australian Dollar from the left column and move along the horizontal line to the US Dollar, the percentage change displayed in the box will represent AUD (base)/USD (quote).